Fundamental Analysis Project |
| Financial Statements |
|
|||||
|
|||||
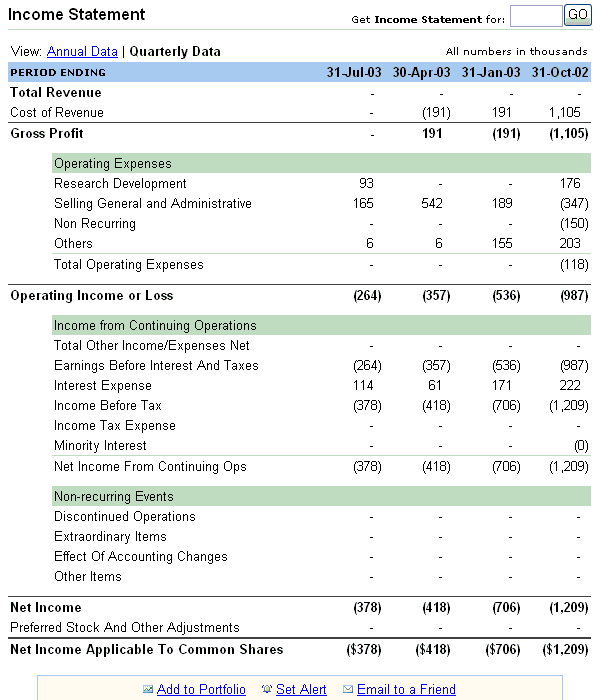
Financial statements The quarterly or annual financial statements that each company publishes and will be used by us are the following. Shows the revenues, expenses, profit over a one year period. Shows the overall financial status of a company at a given point of time. Similar to the income statement; but does not include depreciation, amortization etc. A short description of each one follows. The income statement provides the most basic financial info on a company i.e. revenues, expenses and profit during a quarter or a whole year. In effect, it reflects the performance of the company during that period of time. It can generally be described by the following formula: Revenue - All Expenses = Income Sample from yahoo finance:
Key points:
The amount of money the company received during the period in question. This is considered by many the most important piece of information about a company.
- Cost of Revenue Shows the production costs that brought the revenue. It includes cost of raw material, worker salary etc. - Operating Expenses Costs of R & D and administration, including marketing, are under operating expenses. - Interest Expenses & Tax All interest (e.g. from loans) and tax paid by the company. - Non-recurring Events Usually one-time expenses that don't fall in the other categories.
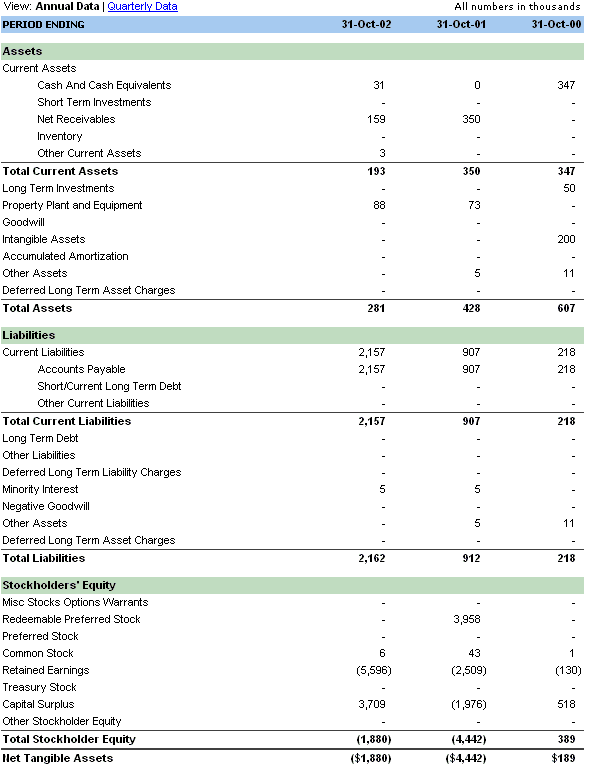
The actual profit of the company after all expenses are deducted from revenue. It is called a "balance sheet" because it has to show that the basic company figures balance out. That is: Liabilities + Stockholder Equity = Assets The Balance Sheet is a snapshot of a company's financial status at a given point in time. One balance sheet cannot give information about growth rate etc, but can show if a company is healthy, or owes too much. Sample from yahoo finance: Key points:
- Current Assets Company assets that can be quickly converted to cash. Apart from actual cash, unsold inventory is an example of current assets. - Non-current Assets Other assets, like equipment, property etc, that cannot be easily converted to cash.
- Current Liabilities Short term liabilities. For example bills that have to be paid before the next statement. - Non-current liabilities It is favorable for a company to have Non-Current liabilities than Current ones, as this would not always mean bad health status for a company.
After subtracting the liabilities from the assets, stockholder equity reflects the current value of the company that stockholders own.
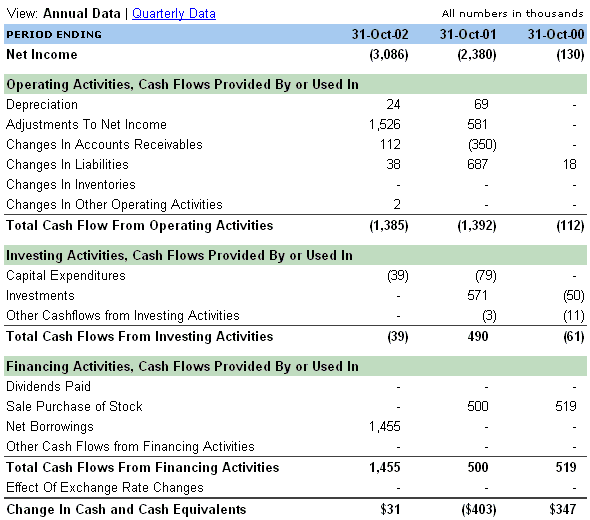
By subtracting intangible assets and goodwill from the equity, we get the book value of the company, which shows how much we would sell all tangible assets for (buildings, inventory, materials etc). Cash Flow Statement The cache flow statement is similar to the income statement; however it does not include non-cache charges and focuses on cache earnings before depreciation or amortization. Sample from yahoo finance: Key points:
All the money that the company made or lost through its normal operating activities.
Investing activities can include any third party bonds/shares/funds bought or sold, as well as property & infrastructure investments.
Financing activities include borrowing or loaning money and money spent or received through company stocks / bonds. Measures The data collected from the above sourses can be used to calculate some more useful measures, like: Debt / Asset ratio A high ratio means a highly leveraged company.
A value of less than 1 shows liquidity problems.
The Working Capital is a measure of a company's liquidity.
An indication of how quickly a company can sell its inventory. A higher number among similar industry companies is favorable.
Margins are generally earnings as % of sales. A useful measure is the Net Margins which is net income divided by net sales, and a low value is a sign of a struggling company.
It is a rather straightforward calculation. However, the more useful prospective EPS growth rate is calculated through the consensus forecast earnings for the following year.
More useful than EPS to compare companies, it is the price per share divided by EPS and makes sense only for a company that has (positive) earnings. For a company with loss there is the PSR (price to sales ratio).
PEG is calculated by dividing a company's expected annual percentage earnings growth taking by it's stock's P/E ratio.
Shows how much more than the book value of the company the market is willing to pay.
ROE is an indication of a company's efficiency. It is calculated by taking a company's after-tax income and dividing by its book value.
These measures show how much pay in dividends an investor can expect from his stock and the percentage of company earnings given as dividends respectively. |