The Z Score Model
MDA(Multiple Discriminant Analysis) is a statistical technique used to classify an observation
into one of several a priori groupings dependent upon the observation's individual characteristics.
It is used primarily to classify and make predictions in problems where the dependent variable
appears in qualitative form, for example, bankrupt or non bankrupt.Therefore the first step is to
establish group classifications.
After the groups are established, data are collected for the objects in the groups. MDA in its
most simple form attempts to derive a linear combination of these characteristics which "best"
discriminates between the groups.If a particular object,for instance, a corporation, has
characteristics(financial ratios) which can be quantified for all the companies in the analysis the
MDA determines a set of discriminant coefficients. When these coefficients are applied to the actual
ratios, a basis for classification into one of the mutually exclusive grouping exists.
The discriminant function of the form Z= V1X1 + V2X2 +...+VnXn transforms the individual variable values
to a single discriminant score , or Z value, which is then used to classify the object where
V1,V2,...Vn = discriminant coefficients
X1,X2....Xn = independent variables
The Z-Score model is a linear analysis in that five measures are objectively weighted and summed up to
arrive at an overall score that then becomes the basis for classification of firms into one of the
a priori groupings(distressed and non distressed).
After initial groups are defined and firms selected, balance sheet and income statement data are collected.
A list of 22 potentially helpful ratios was compiled for evaluation and the 5 of them were finally chosen
for doing the best overall job together in the prediction.The following procedures are utilized:
(1)observation of the statistical significance of various alternative functions,including determination of the
relative contributions of each independent variable.(2)evaluation of intercorrelations among the relevant
variables(3)observation of the predictive accuracy of the various profiles and (4) subjective judgement
The ratios are classified into five standard categories, including liquidity,
profitability,leverage,solvency,activity.
The final discriminant function is as follows:
Z= 1.2X1 + 1.4X2 + 3.3X3 + 0.6X4 + 0.999X5
where
X1 = working capital/total Assets
X2 = retained earnings/total Assets
X3 = earnings before interests and taxes/total Assets
X4 = market value of equity/book value of total liabilities
X5 = sales/total Assets
Z = overall index
X1(Working Capital/Total Assets)
The working capital/total assets ratio is a measure of the net liquid assets of the firm relative to the
total capitalization.Working capital is defined as the difference between current assets and current
liabilities.Ordinarily a firm experiencing consistent operating losses will have shrinking current assets
in relation to total assets.
X2(Retained Easrnings/Total Assets)
Retained earnings is the account which reports the total amount of reinvested earnings and/or losses of a
firm over its entire life. The account is also referred to as earned surplus. The RE/TA ratio measures
the leverage of a firm.Those firms with high RE, relative to TA, have financed their assets through retention
of profits and have not utilized as much debt.
X3(Earnings before Interest and Taxes/Total Assets)
This ratio is a measure of the true productivity of the firm's assets,independent of any tax or leverage
factors.Since a firm's ultimate existence is based on the earning power of its assets, this ratio appears to be
particularly appropriate for studies dealing with corporate failure.
X4(Market Value of Equity/Book Value of Liabilities)
Equity is measured by the combined value of all shares of stock,preferred and common,while liabilities
include bothe current and long term.The measure shows how much the firm's assets can decline in value
before the liabilities exceed the assets and the firm becomes insolvent.
X5(Sales/Total Assets)
The capital-turnover ratio is a standard financial ratio illustrating the sales generating ability
of the firm's assets. It is one measure of management's capacity in dealing with competitive conditions.
The Revised Z-Score model
A complete reestimation of the model occurs by substituting the book values of equity for the
Market value in X4. All the coefficients change and the classfication criterion and related cut-off
scores also change.The revised Z score is as follwos:
Z' = 0.717X1 + 0.847X2 + 3.107X3 +0.420X4 +0.998X5
A Further Revision
The next modification of the Z-score analyzed the characteristics and accuracy of a model without
X5 - sales/total assets.We do this to minimize the potential industry effect which is more likely to take
place when such an industry sensitive variable as asset turnover is included.The new Z score is as follows:
Z'' = 6.56X1 + 3.26X2 +6.72X3 +1.05X4
Results
The Z-Score method was applied to first the S&P 500 stocks and later to the whole dataset.
S&P 500 Results
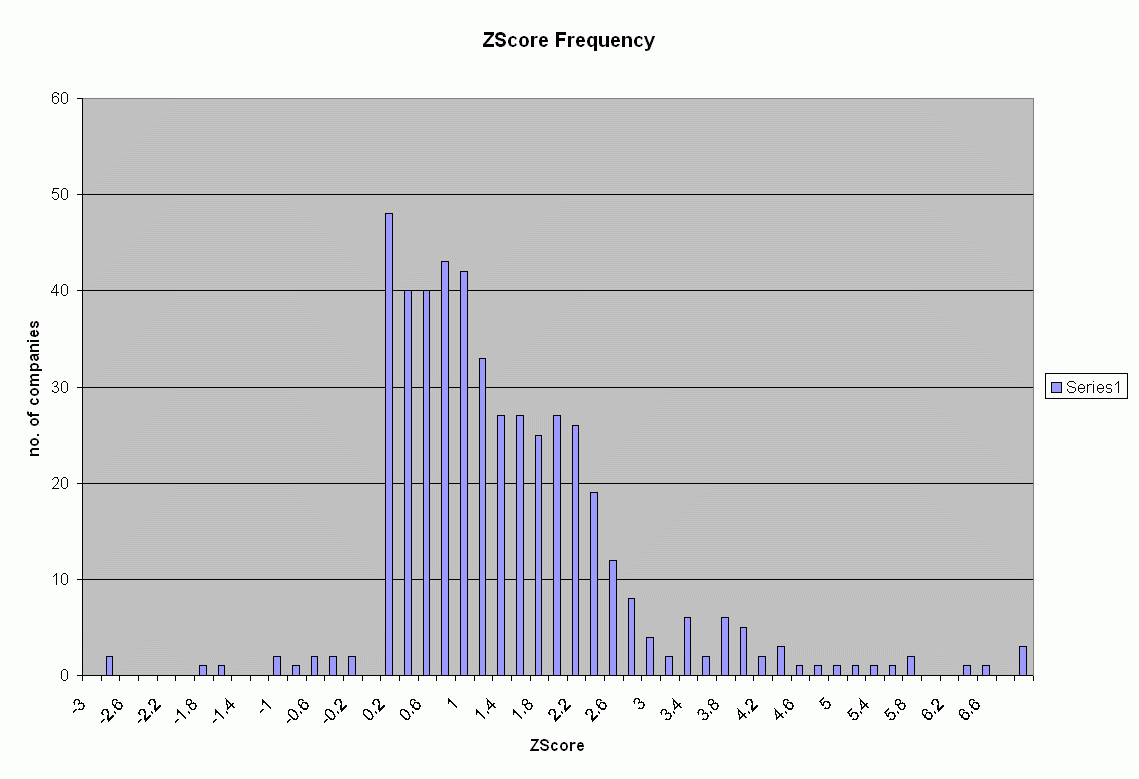
Z-score
Companies that got scores 0.91 were classified as approaching bankruptcy, those that received a score
greater than 2.07 were considered healthy and those that lay between fell in the grey area.
Click here to see the Companies going bankrupt.
Click here to see the Healthy Companies.
Click here to see the Companies that fall in the grey area.
Click here to see some Z-score statistics.
Click here for the code.

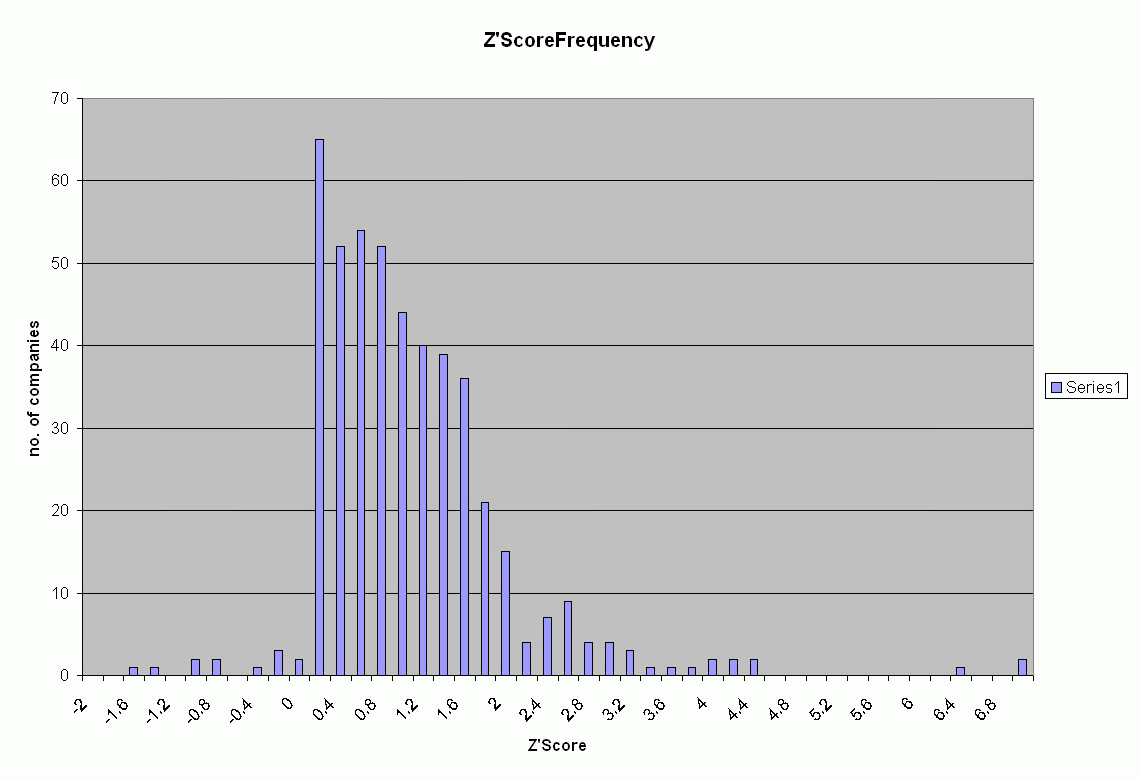
Z'-score
Companies that got scores 0.41 were classified as approaching bankruptcy, those that received a score
greater than 1.9 were considered healthy and those that lay between fell in the grey area.
Click here to see the Companies going bankrupt.
Click here to see the Healthy Companies.
Click here to see the Companies that fall in the grey area.
Click here to see some Z'-score statistics.
Click here for the code.

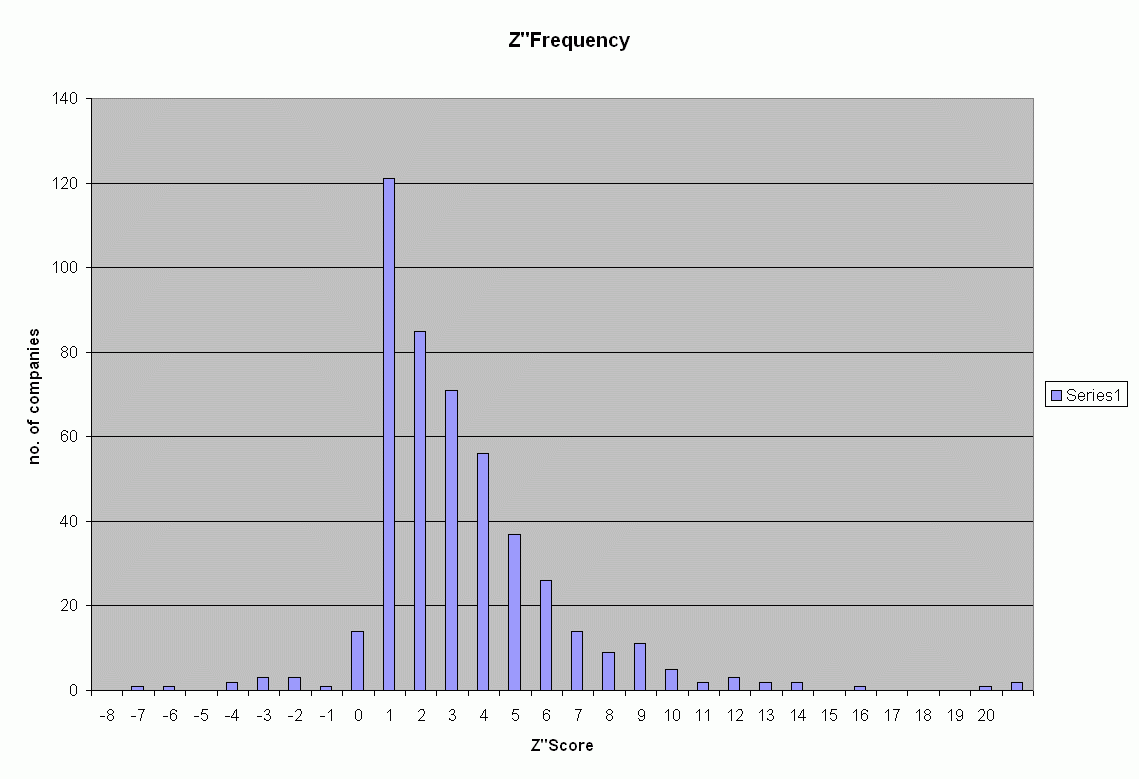
Z''-score
Companies that got scores 0.7 were classified as approaching bankruptcy, those that received a score
greater than 1.07 were considered healthy and those that lay between fell in the grey area.
Click here to see the Companies going bankrupt.
Click here to see the Healthy Companies.
Click here to see the Companies that fall in the grey area.
Click here to see some Z''-score statistics.
Click here for the code.


