 | |||||||||||||||||||||||||||||||||||||||||||||||||||||||||||||
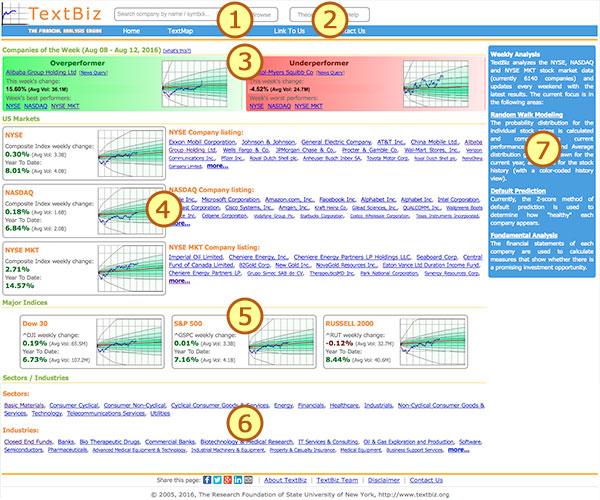
Random Walk GraphsThe "average" (predicted price distribution) graphs provides the probability distribution for a stock price until the end of the year, and it gives you the current percentile. For example, if a stock reports a percentile of 70% then it closed better than 70% of our random walks, indicating rather good performance. Here is the detailed key for the predicted price distribution graphs:
The "min / max" (High to Date and Low to Date) graph shows the probability for a stock to either rise or to have risen to a specific high price, or to have dropped to a low price. For example, if your stock price corresponds to a max (blue) percentile of 60%, then for 60% of the random walks, the model had not reached the current price at any date up to today. Here is the detailed key for the High to Date / Low to Date graphs:
If you want to learn more about random walks, you can checkout the theory Here. Note that the average historic volatility (Parkinson High-Low) is calculated using the previous year's quotes. A standard drift of 7% is always applied to the calculation, which is the growth we get if we see the stock market at a historic perspective (i.e. Dow Jones Industrial index for over half a century). As for the closing prices, we always use adjusted values.
Adjusted Close PricesThroughout TextBiz, adjusted close prices are used. The adjustment is done to cancel out the effect that stock splits and dividends have to our time series. For example, let's say a stock costs $40 and the next day is split 2:1 (meaning for each 1 stock you get 2 of the same value) and that the next day the stock costs $22. Since you now have 2x22=$44 dollars worth of stocks, the price actually went up. It is obvious we cannot use actual close prices for our modeling. We will have to "travel back" the time series, starting from today multiplying by the cumulative adjustment for each time period. For example if 5 days ago we had that 2:1 split, prices from that point of time and backwards are adjusted by 0.5. If 100 days ago we had another 2:1 split, prices from that moment on (or back in time) will be adjusted by 0.5x0.5=0.25. If a year ago the stock paid a dividend, we calculate the dividend as a percentage of that day's actual price, we subtract it from 1 and multiply again with our cumulative adjustment factor for that point of time. There is only one "catch" with the Adjusted Close Prices used in the website. Normally, only the current years Price Distribution (Random Walk) graphs are recreated every week, in order for them to be current. To save processing power, the previous years are not recreated that often, even if the adjusted close prices have changed. So, you might see some graphs whose prices might not be directly comparable to the current stock price due to a split, but the analysis for that year is still valid. If we later decide to devote more processing power, there won't be such a case.
Color Coded Year SidebarThe color of the year buttons in the left sidebar reflects the performance of the stock compared to the expectations as derived from the Random Walk distribution graphs. The more the button deviates towards the red (from the neutral gray), the worse the year was for the company, while green indicates a "good year". Here is a linear graph of the color coding (percentiles 0-100 refer to the Random Walk distribution graphs):
Note that the years that have exactly 0% or 100% probabilities are marked by dark gray, as their behavior during that year is not considered normal.
Default PredictionWe calculate the Z scores for all companies to get an idea of their "health". Two graphs are provided, the first plots the company in respect to the sector and the second in respect to the industry. The company score is noted with blue letters on the graph, and a blue vertical line. Scores less than 1.8 (red area) are considered to indicate unhealthy companies, while the companies with over 3 (green area) are considered healthy. The scores are only calculated using the annual reports, as they can vary wildly with quarterly statements due to various accounting events such as write-offs etc, which is why usually the last year's score (based on the Dec 31 statements) is highlighted. The Z' and Z'' scores are mostly not intended for public companies, but they are provided for reference. If you want to learn more about default prediction, you can checkout the theory Here
Fundamental AnalysisWe can use the financial statements of a company to find out a lot of information about it, and decide if it is a promising investment. The various measures that are calculated, are describe in the theory section Here.
Company of the weekEvery week, two companies are chosen as interesting for their positive or negative performance during the previous week. The companies are chosen by a formula that takes into account the weekly change in the price, as well as the size (market cap) of a company. | |||||||||||||||||||||||||||||||||||||||||||||||||||||||||||||
|
|||||||||||||||||||||||||||||||||||||||||||||||||||||||||||||
© 2005, 2016, The Research Foundation of State University of New York, http://www.textbiz.org |