Companies of the Week (May 08 - May 12, 2017) |
Weekly Analysis
TextBiz analyzes the NYSE, NASDAQ and NYSE MKT stock market data (currently 6140 companies) and updates every weekend with the latest results. The current focus is in the following areas:
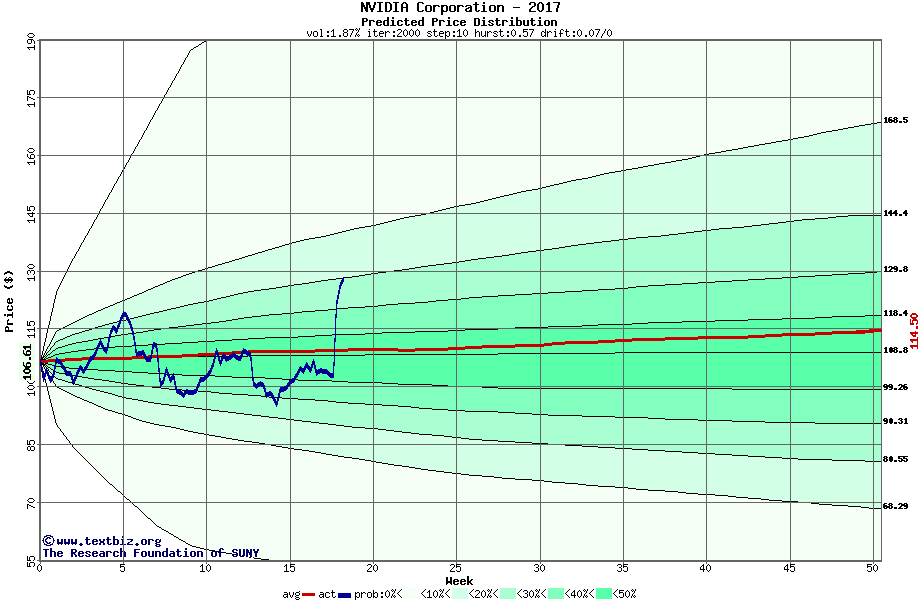
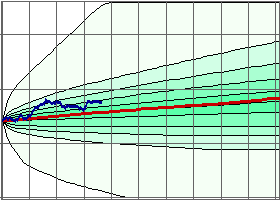
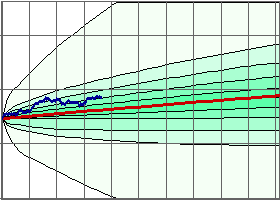
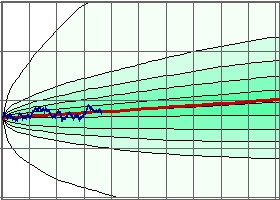
Random Walk Modeling
The probability distribution for the individual stock prices is calculated and compared to current performance. Min/Max and Average distribution graphs are drawn for the current year, as well as for the stock history (with a color-coded history view).
Default Prediction
Currently, the Z-score method of default prediction is used to determine how "healthy" each company appears.
Fundamental Analysis
The financial statements of each company are used to calculate measures that show whether there is a promising investment opportunity. |
|
|
|
|
US Markets |
NYSEComposite Index weekly: -0.52% (Avg Vol: 3.6B) Year To Date: 3.66% (Avg Vol: 3.5B) |
 |
NYSE Company listing:
Exxon Mobil Corporation, Johnson & Johnson, JPMorgan Chase & Co., Alibaba Group Holding Ltd, Wells Fargo & Co, General Electric Company, Bank of America Corp, AT&T Inc., Procter & Gamble Co, Wal-Mart Stores Inc, China Mobile Ltd., Royal Dutch Shell plc, Berkshire Hathaway Inc., Anheuser Busch Inbev SA, Chevron Corporation, PetroChina Company Limited, Pfizer Inc., more... |
|
NASDAQ
Composite Index weekly:
0.34% (Avg Vol: 1.9B)
Year To Date:
12.8% (Avg Vol: 1.9B) |
 |
NASDAQ Company listing:
Apple Inc., Microsoft Corporation, Amazon.com, Inc., Facebook Inc, Alphabet Inc, Alphabet Inc, Comcast Corporation, Cisco Systems, Inc., Intel Corporation, Amgen, Inc., Kraft Heinz Co, Broadcom Ltd, Celgene Corporation, Walgreens Boots Alliance Inc, Priceline Group Inc, Charter Communications, Inc., Starbucks Corporation, Gilead Sciences, Inc., QUALCOMM, Inc., more... |
|
NYSE MKT
Composite Index weekly:
1.26%
Year To Date:
10.7% |
 |
NYSE MKT Company listing:
Imperial Oil Ltd, Cheniere Energy, Inc., Cheniere Energy Partners LP Holdings LLC, Seaboard Corp, Central Fund of Canada Limited, B2Gold Corp, Globalstar, Inc., Straight Path Communications Inc, Cheniere Energy Partners LP, New Gold Inc., Grupo Simec SAB de CV, Synergy Resources Corp, Eaton Vance Ltd Duration Income Fund, Park National Corporation, NovaGold Resources Inc., more... |
|
Major Indices |
Dow 30
^DJI weekly change: -0.45% (Avg Vol: 281.7M) Year To Date: 5.15% (Avg Vol: 306.4M) |
 |
S&P 500^GSPC weekly change: -0.38% (Avg Vol: 3.6B) Year To Date: 6.19% (Avg Vol: 3.5B) |
 |
RUSSELL 2000
^RUT weekly change: -0.98% (Avg Vol: 35.5M) Year To Date: 1.82% (Avg Vol: 35.5M) |
 |
|
Sectors / Industries |
Sectors: |
Basic Materials, Consumer Cyclical, Consumer Non-Cyclical, Energy, Financials, Healthcare, Industrials, Technology, Telecommunications Services, Utilities |
Industries: |
Closed End Funds, Banks, Bio Therapeutic Drugs, Commercial Banks, Biotechnology & Medical Research, IT Services & Consulting, Oil & Gas Exploration and Production, Software, Semiconductors, Medical Equipment, Pharmaceuticals, Advanced Medical Equipment & Technology, Industrial Machinery & Equipment, Oil Related Services and Equipment, Apparel & Accessories, more... |
|