|
Harvest Natural Resources, Inc. - 2013 (Inactive Symbol) |
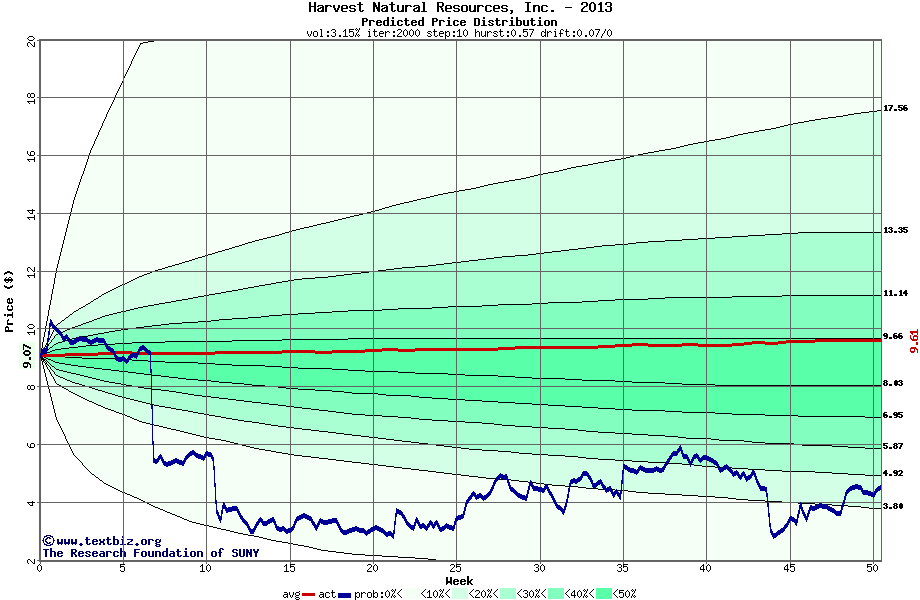
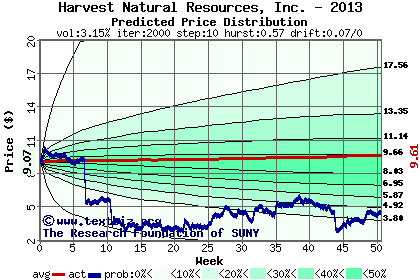
YTD Price Probability |
The following graph plots the year-to-date performance of the stock for 2013 compared to the probability calculated by a random walk model.
Initial Value*: $9.1
Hist. Volatility: 3.15%
Annual Drift: 7%
Final Value*: $4.5
Percentile: 16% |
 |
| Click on the image for the high resolution version. |
* Stock quotes on TextBiz are always adjusted close prices (what's this?). |
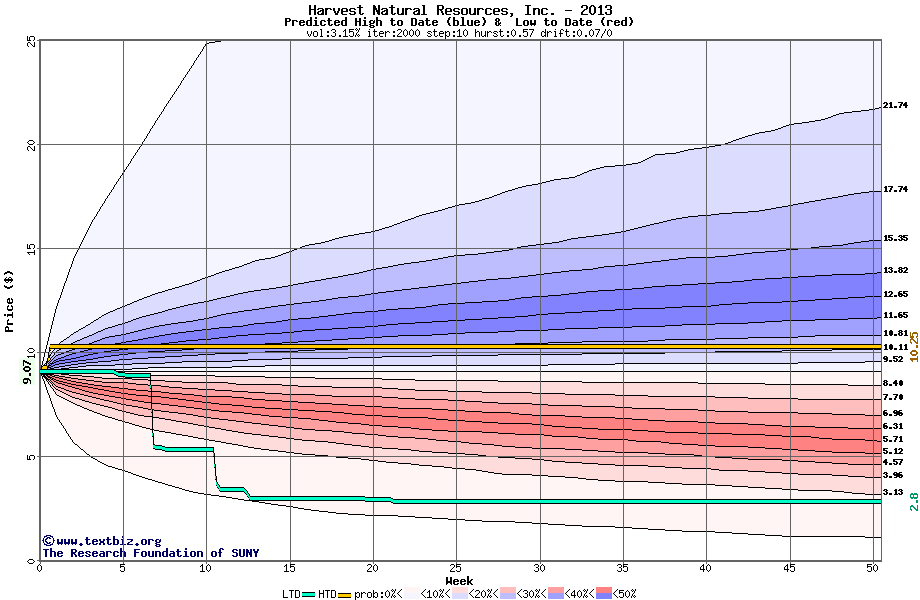
HTD - LTD Price Probability |
The high to date and low to date prices of the stock plotted against a random walk model for 2013 (what's this?).
|
| |
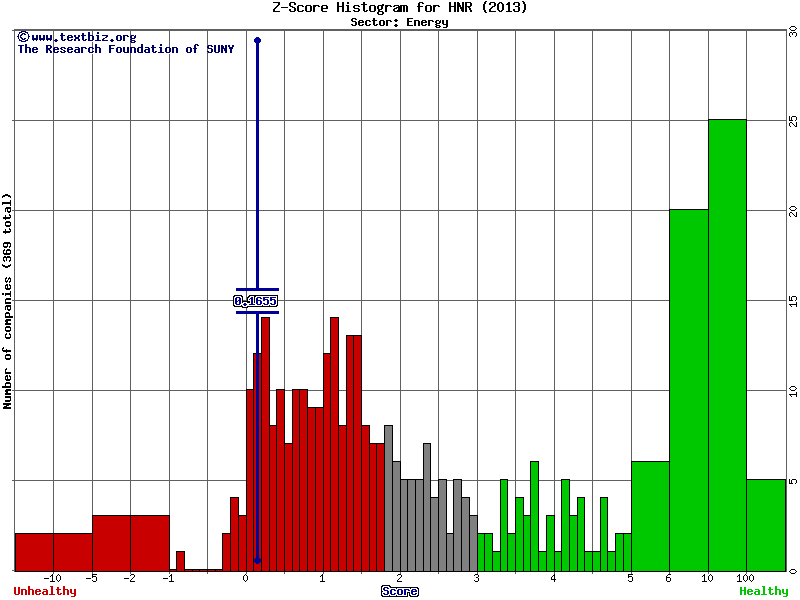
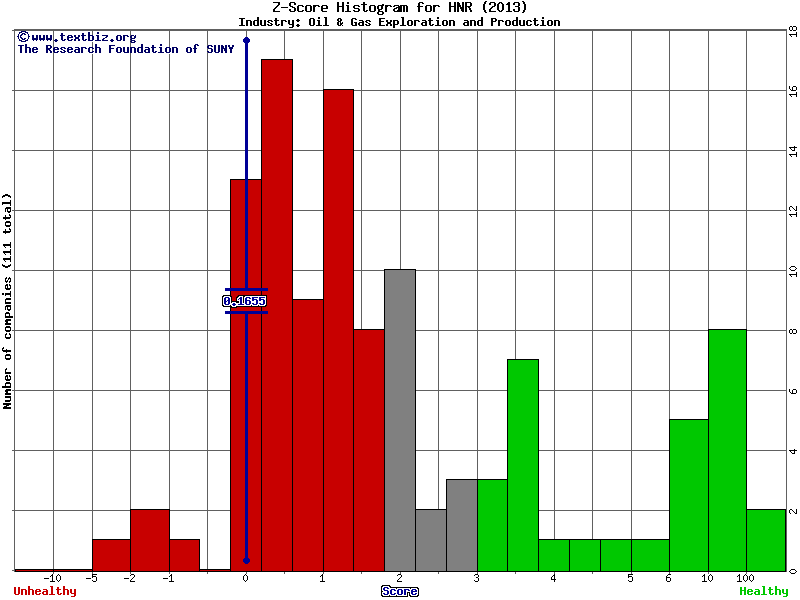
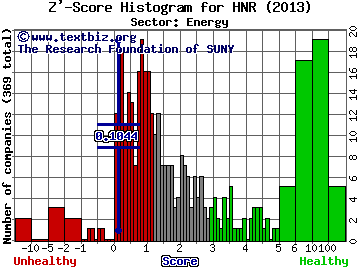
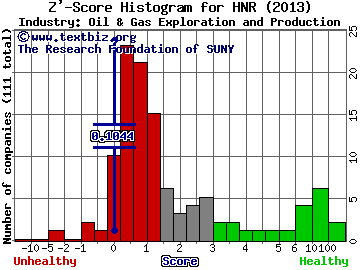
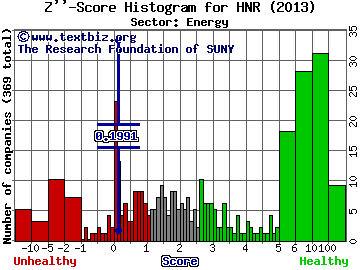
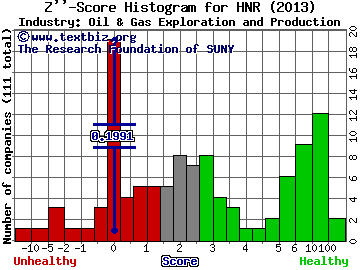
Default Prediction for 2013-12-31 |
| |
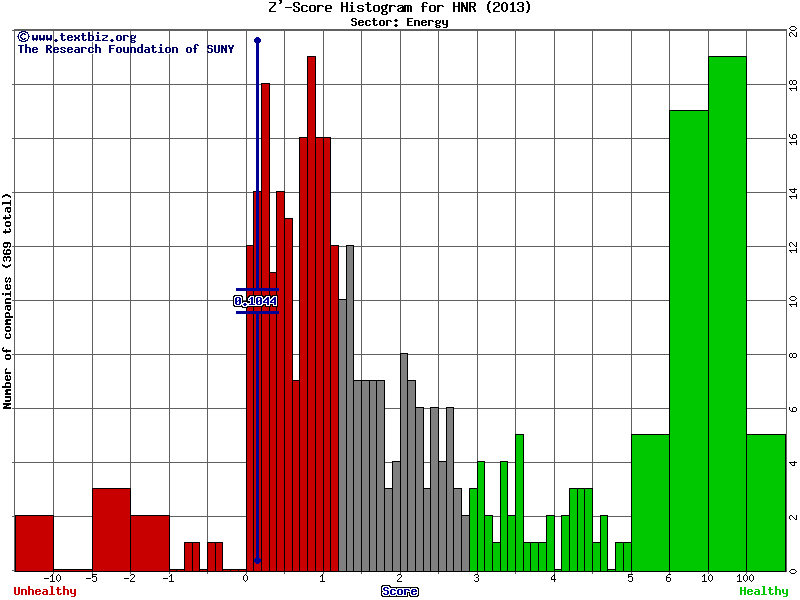
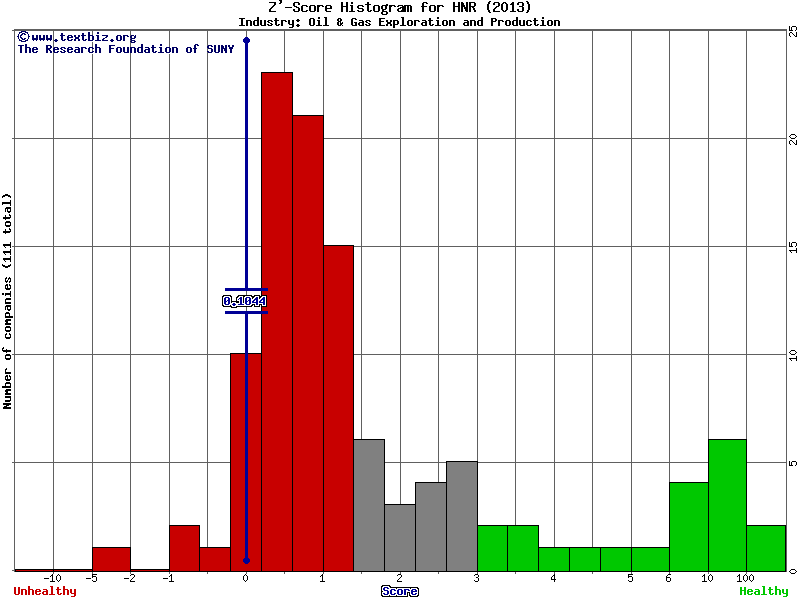
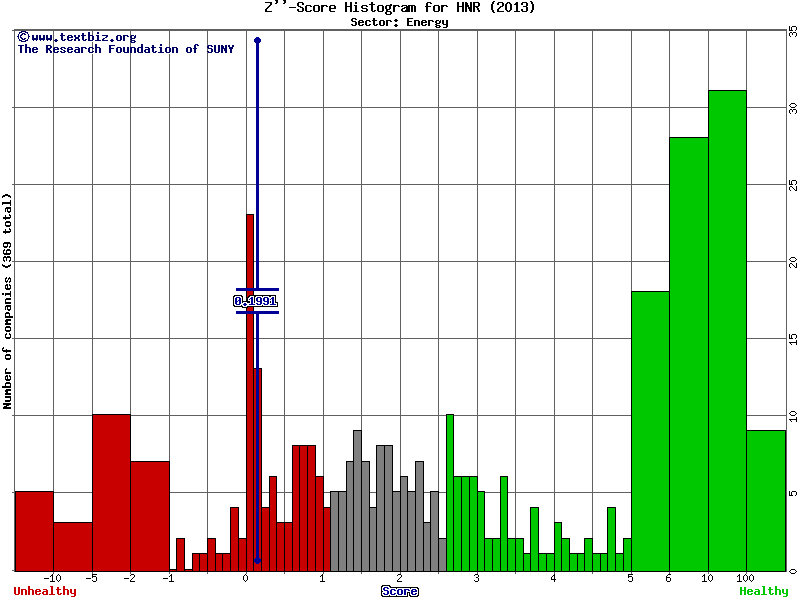
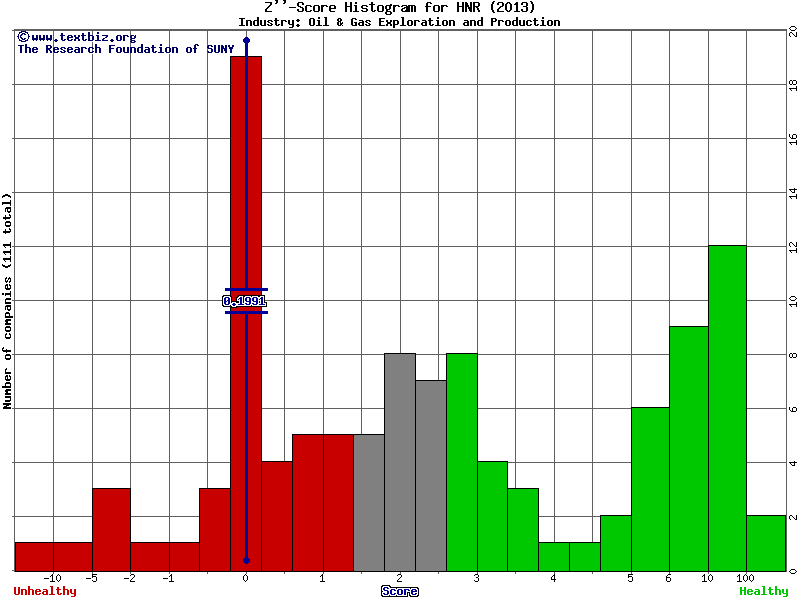
Default prediction by Z-Score (what's this?).
View the other companies in the same industry : Oil & Gas Exploration and Production
Alternative Z-Scores designed for non-public companies (i.e. take these with a grain of salt):
For manufacuring companies:
Sector Industry
  |
For non-manufacturing companies:
Sector Industry
  |
|