Current Profile
 
History
2017
2015
2014
2013
2012
2011
2010
2009
2008
2007
2006
2005
2004
2003
2002
2001
2000
1999
1998
1997
1996
1995
1994
1993
1992
1991
1990
1989
1988
1987
1986
1985
1984
1983
1982
1981
1980
1979
1978
1977
1976
1975
1974
1973
1972
1971
1970
1969
1968
1967
1966
1965
1964
1963

International Business Machines Corp. - 2016  (Inactive Symbol)

YTD Price Probability

The following graph plots the year-to-date performance of the stock for 2016 compared to the probability calculated by a random walk model.

Initial Value*: $132.6

Hist. Volatility: 1.01%

Annual Drift: 7%

Final Value*: $166.0

Percentile: 82%

Predicted price distribution
Click on the image for the high resolution version.
* Stock quotes on TextBiz are always adjusted close prices (what's this?).

HTD - LTD Price Probability

The high to date and low to date prices of the stock plotted against a random walk model for 2016 (what's this?).


Default Prediction for 2016-12-31


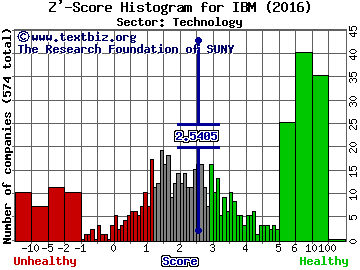
Default prediction by Z-Score (what's this?).

Z Score :  
3.4261   

Sector

Industry

View the other companies in the same industry : Technology Consulting & Outsourcing Services

Alternative Z-Scores designed for non-public companies (i.e. take these with a grain of salt):

For manufacuring companies:
Z' Score :  
2.4249   

Sector         Industry
    

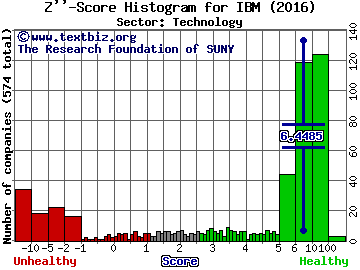
For non-manufacturing companies:
Z'' Score :  
6.1594   

Sector         Industry