|
|
 |
Annaly Capital Management, Inc. (Inactive Symbol) |
YTD Price Probability |
No random walk data for 2025
|
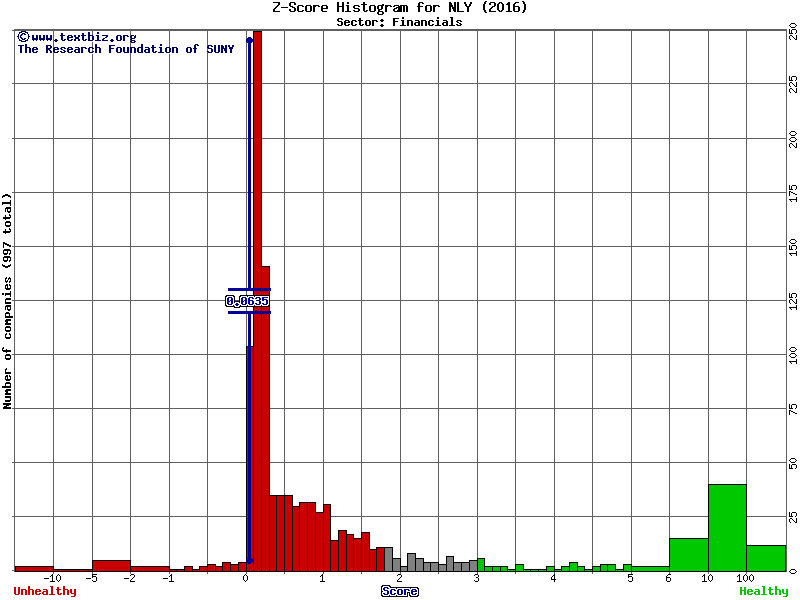
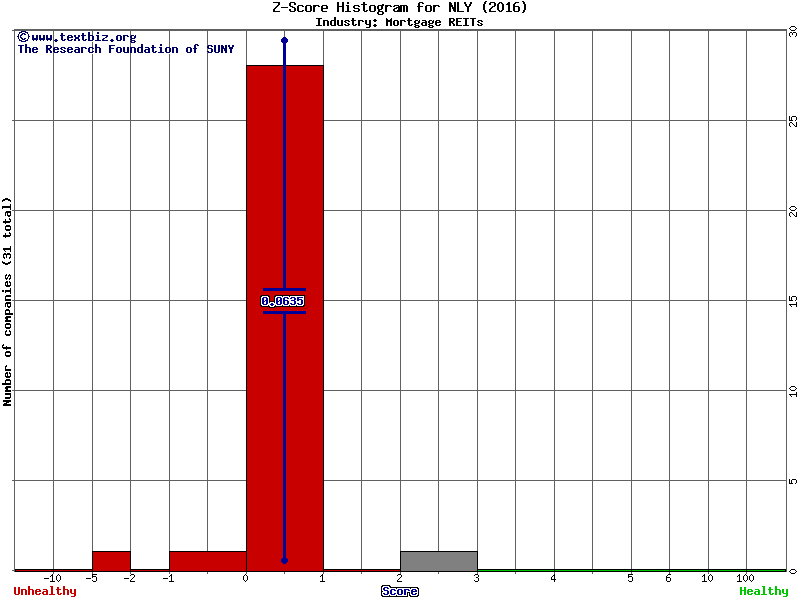
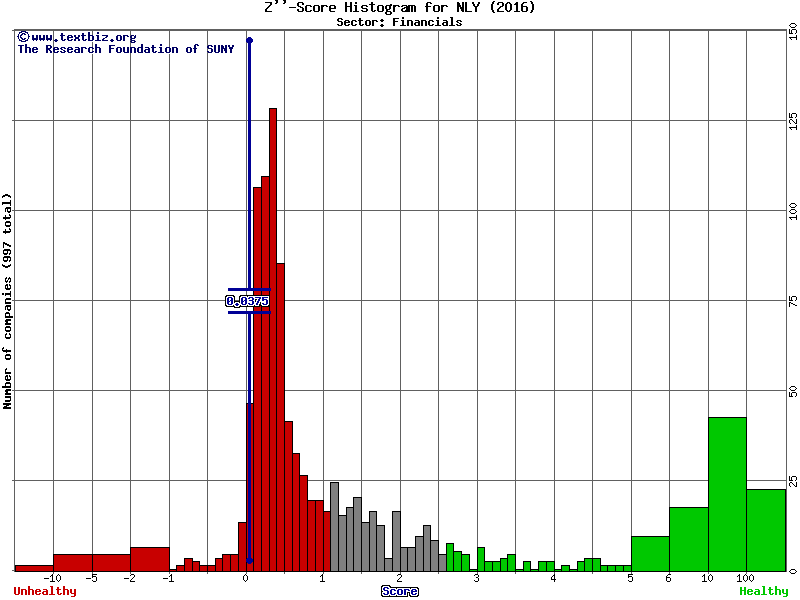
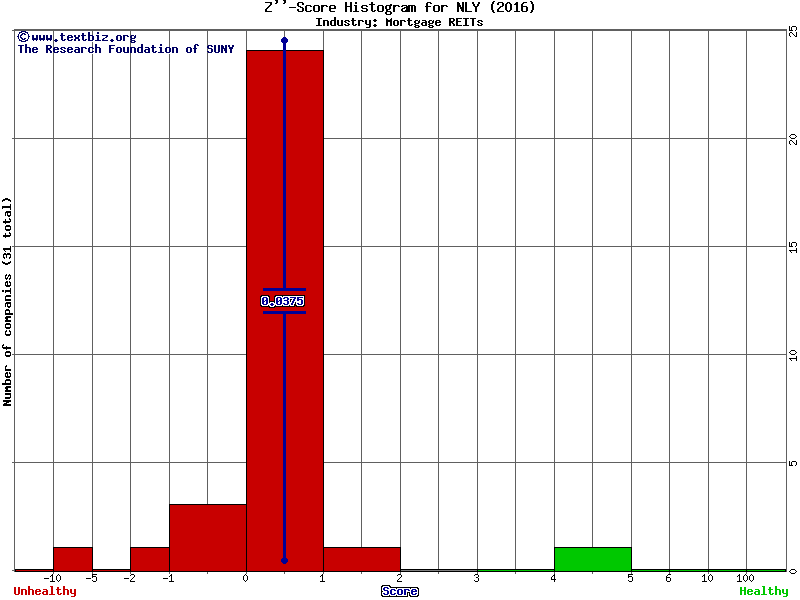
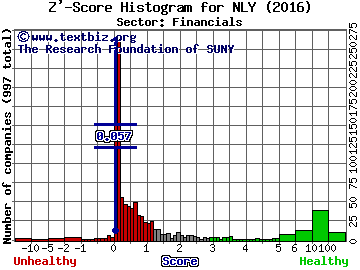
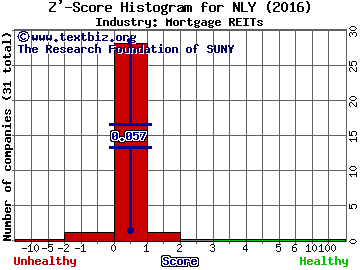
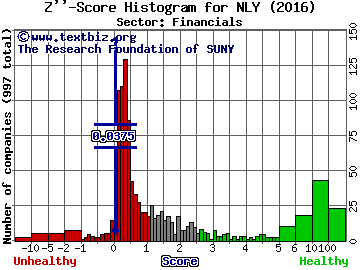
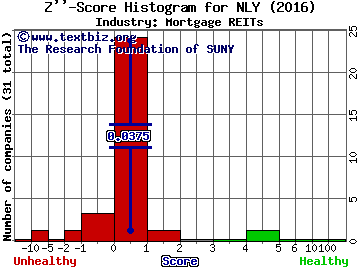
Default Prediction for 2016-12-31 |
Default prediction by Z-Score (what's this?).
View the other companies in the same industry : Mortgage REITs
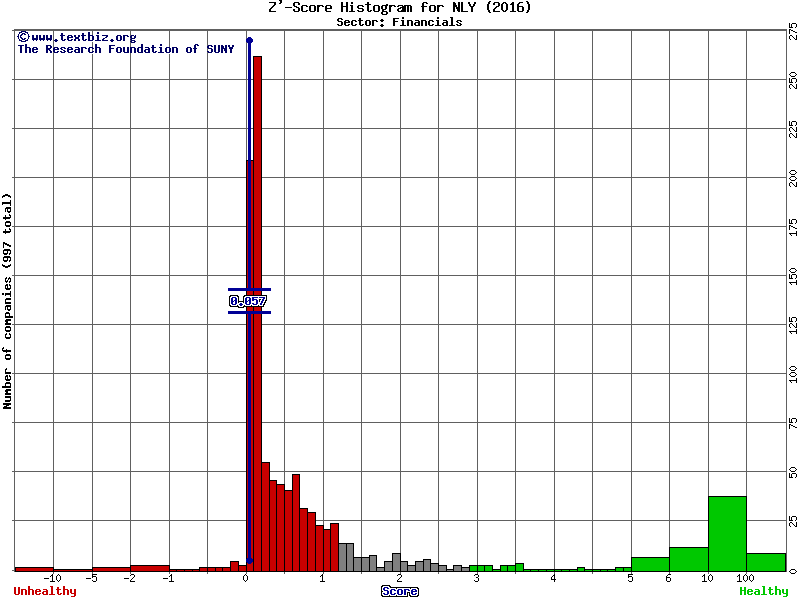
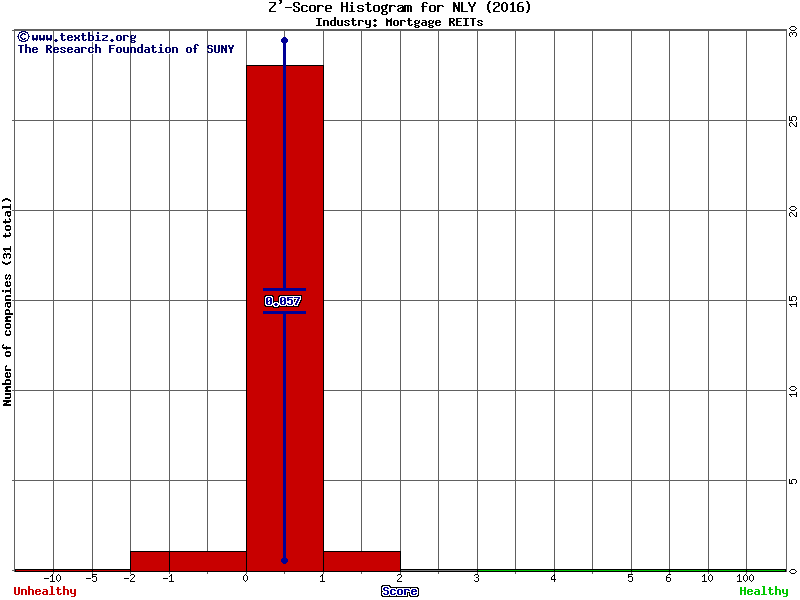
Alternative Z-Scores designed for non-public companies (i.e. take these with a grain of salt):
For manufacuring companies:
Sector Industry
  |
For non-manufacturing companies:
Sector Industry
  |
|
Fundamental Analysis for 2017 |
Fundamental Analysis metrics & ratios (what's this?).
Date of financial statements used: 2017-03-31 |
| Book Value: |
$11.3B |
|
Internal Value: |
$11.3B |
|
Working Capital: |
N/A |
| Debt to Asset Ratio: |
0.851 |
|
Current Ratio: |
N/A |
|
Turnover Ratio: |
N/A |
| Net Margin: |
63.5% |
|
EPS: |
1.727 |
|
P/E ratio: |
6.543 |
| P/B ratio: |
1.017 |
|
ROE: |
15.5% |
|
ROA: |
2.1% |
|
|
Company ProfileSymbol: NLY Market Cap: $11.5B Exchange: NYSE Sector: Financials Industry: Mortgage REITs Data Since: 1998-01-02 Website: www.annaly.com
[Web Query]
[News Query]
|